Have you ever had a critical service start failing, but so quietly you don't notice for hours? That's what happened to me. To be fair, it was entirely my fault. I use a custom domain for my email, which is ultimately handled by a standard Gmail account. For years, I'd routed outbound mail through a third-party SMTP service. That service sent emails warning me that their free plan was being discontinued, but I'd failed to notice and act on them.
The result was a "semi-silent failure." My outbound emails started getting stuck in a strange limbo—no immediate error, just an email hours later saying the delivery was "delayed." This was incredibly frustrating, and I realized I had zero visibility into a critical service. I needed a way to proactively and continuously monitor my email's health. I didn't want to guess if it was working; I wanted data. So, I built MailMon.
The Solution: A Round-Trip Email Monitor
MailMon is a personal email monitoring system I built to measure email delivery latency. The concept is simple:
- Automatically send a test email from a primary Gmail account (using my custom domain) to a separate monitor account every few hours.
- When the monitor account receives the email, it automatically sends a reply.
- Measure the time it takes for the initial email to arrive (outbound latency) and for the reply to get back (inbound latency).
- Track the total round-trip time (RTT) and export all these metrics to a monitoring system.
This workflow continuously validates that my entire email pipeline—sending, receiving, and routing—is healthy.
How It Works: The Technical Details
The application is built in Python using a few key components:
- FastAPI: Serves as the lightweight web server to handle incoming webhook notifications from Google.
- APScheduler: A scheduler that triggers a new test email at a configurable interval (I set mine to every 6 hours).
- Google Cloud Pub/Sub: Instead of constantly polling Gmail to see if an email has arrived (which is inefficient), I use Google's Pub/Sub service. Gmail sends an instant push notification to my application's webhook the moment a new email arrives.
- Prometheus & Grafana: The application exports all timing metrics in a format that Prometheus can scrape. This allows me to visualize the data and track trends in Grafana.
Here’s a look at the logs from a single, successful test run. You can see the moment the reply is found and the final round-trip time is calculated.

Code Highlights Worth Sharing
While the repository for this project is private, a few design decisions and code snippets are worth highlighting because they form the core of the application's logic.
1. Tracking Emails with Message-ID
To reliably track the test email and its reply, the system relies on the unique Message-ID header present in every email. Instead of searching by a subject line, which could be unreliable, the application fetches the Message-ID of the outbound email and then uses Gmail's rfc822msgid: query to find that exact message when the webhook notification arrives. This approach is fast, precise, and guarantees no false positives.
# Direct, unambiguous search for the reply's unique ID
query = f'rfc822msgid:{reply_message_id}'
response = primary_service.users().messages().list(userId='me', q=query).execute()

if 'messages' in response and len(response['messages']) > 0:
    found_msg = response['messages'][0]
    logging.info(f"✅ Found reply for test {test_id}.")
    # ... mark as read and calculate round-trip time ...
2. Efficient Notifications with Pub/Sub Webhooks
Using Google Pub/Sub for push notifications is far more efficient than polling. Setting this up involves telling Gmail to send a message to a topic whenever new mail arrives. My FastAPI application then just needs a simple endpoint to listen for these messages.
This function in src/main.py handles the incoming notifications, decodes the message from Google, and kicks off the processing logic asynchronously so the webhook can return a response immediately.
@app.post("/webhook/gmail/{email_account}")
async def gmail_webhook(email_account: str, request: Request):
    """Receives notifications from Google Pub/Sub."""
    try:
        body = await request.json()
        message = body.get('message', {})
        # ... decode the base64 data from the notification ...
        notification = json.loads(data)

        notification_email = notification.get('emailAddress')

        # ... process the notification in the background ...
        asyncio.create_task(process_notification(notification_email, history_id))

        return {"status": "ok"}
    # ... error handling ...
3. Real Observability with Prometheus Metrics
Simply logging the round-trip time to the console is useful, but it doesn't help you spot trends. To get true observability, I used the prometheus-client library to define and export key metrics. This turns my application into a data source that my existing observability stack can use.
Defining the metrics in src/main.py is straightforward. I use a Histogram for the overall round-trip time (which is great for calculating percentiles like p95) and Gauges to track the most recent latency values for each leg of the journey.
# METRICS DEFINITIONS
RTT_HISTOGRAM = Histogram('mailmon_roundtrip_time_seconds', 'Email round-trip time.')
RTT_GAUGE = Gauge('mailmon_roundtrip_time_last_seconds', 'The last measured email round-trip time in seconds.')
OUTBOUND_RTT_GAUGE = Gauge('mailmon_outbound_latency_seconds', 'The last measured outbound (primary to monitor) latency.')
INBOUND_RTT_GAUGE = Gauge('mailmon_inbound_latency_seconds', 'The last measured inbound (monitor to primary) latency.')
The Final Result: Peace of Mind in a Graph
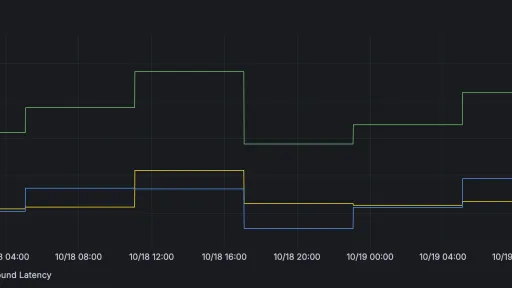
With the metrics being collected by Prometheus, I built a simple dashboard in Grafana. Now, at a glance, I can see the health of my email system over time. I can clearly distinguish between the outbound and inbound latency, and I can immediately spot any spikes or deviations from the norm.

Ultimately, this project solved a real-world problem by applying modern DevOps and automation principles to a personal service. It's a practical demonstration of how to build a custom monitoring solution from the ground up, providing proactive insights and ensuring a critical system remains reliable. I no longer have to wonder if my email is working; I have the data to prove it.


